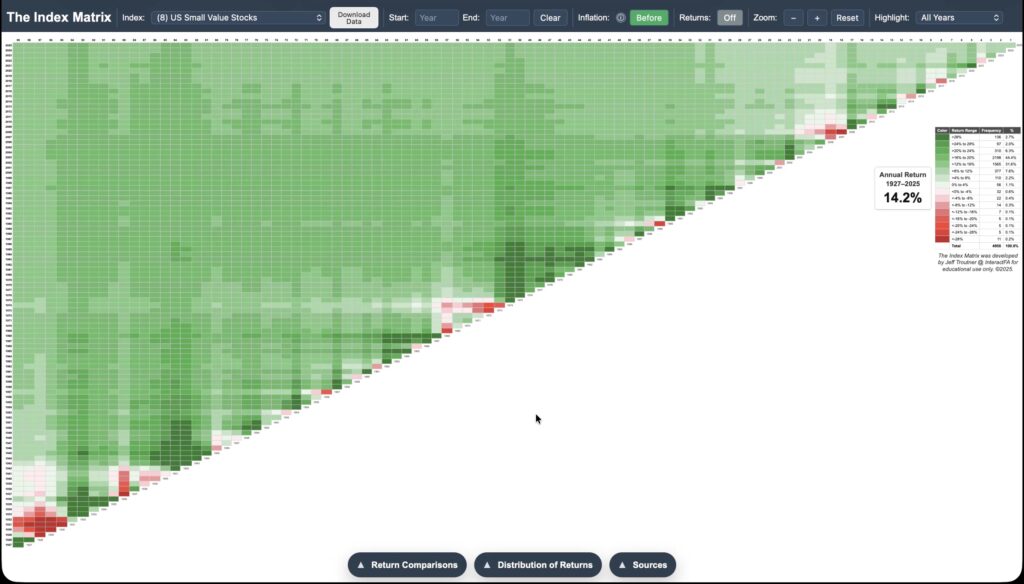
Updated through 2025, the Index Matrixis a browser-based app that displays the historical returns for 13 U.S. and International asset class indexes using a visually powerful heat-mapping technique.
From any starting year along the diagonal, investors can view yearly returns from 1927 for most US indexes and annualized returns (up from the diagonal) for longer periods up to 99 years. Heat mapping of return ranges offers a big picture view of the “green pastures” the US stock market offers to patient investors who can get beyond the “barbed wire” of short-term return volatility.
**Note to Advisors: If you are not printing the Index Matrix posters for the US Total Market and US Small Cap Value (at the least) to display in your office, you are missing a huge opportunity to enlighten new and existing clients to the power of long-term investing. Trust me, these are unique and engaging conversation starters that will set the stage for deeper discussions with your clients.
Download the PDF files, go to VistaPrint.com to order 24″ x 36″ posters, and frame locally or buy frames online through Amazon. Then share your stories with me about the responses you receive!
Play Video
The Index Matrix Demo 2-15-2026
This video walks you through the features of the newest Index Matrix app and how it can help develop realistic expectations of stock market and asset class returns.
Reimagining the Matrix Book
Dimensional Fund Advisors featured our work with The Index Matrix and investing images in the 40th Anniversary edition of their popular Matrix Book. Matrix Book 2021.
Dimensional-approved advisors can watch the webcast “Bringing the Matrix Book to Life” here. It features Jeff & TJ Troutner of Equius Partners demonstrating these tools.