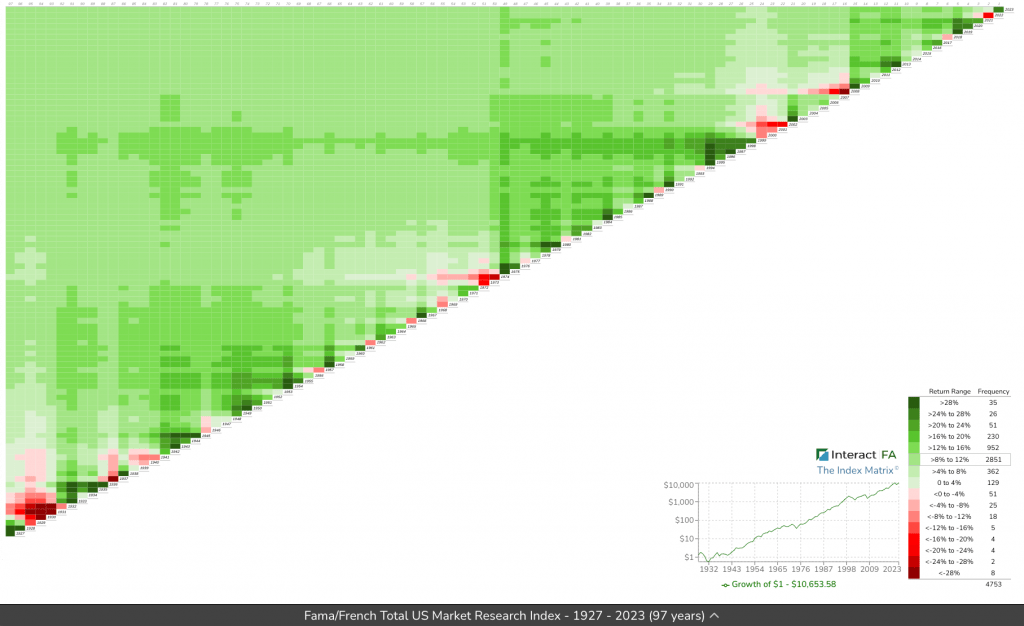
Updated through 2024, the Index Matrixis a browser-based app that displays the historical returns for 41 US and non-US asset class indexes (Asia/Pacific, Australia, Canada, Europe and Scandinavia, Japan, and UK) using a visually powerful heat-mapping technique.
From any starting year along the diagonal, investors can view yearly returns from 1927 to 2024 (for most US indexes) and annualized returns (up from the diagonal) for longer periods up to 97 years. Heat mapping of return ranges offers a big picture view of the “green pastures” the US stock market offers to patient investors who can get beyond the “barbed wire” of short-term volatility.
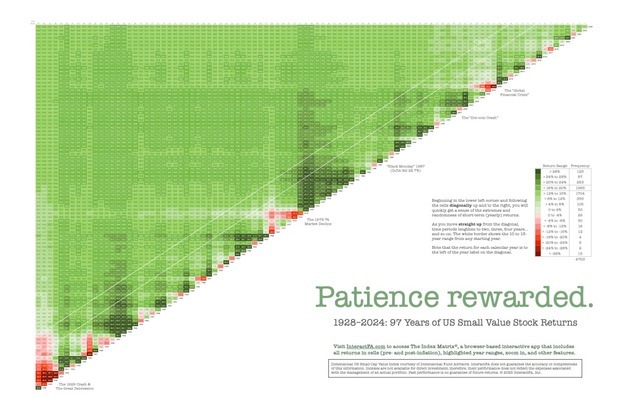
**Note to Advisors: If you are not printing the Index Matrix posters for the US Total Market and US Small Cap Value (at the least) to display in your office, you are missing a huge opportunity to enlighten new and existing clients to the power of long-term investing. Trust me, these are unique and engaging conversation starters that will set the stage for deeper discussions with your clients.
Download the PDF files, go to VistaPrint.com to order 24″ x 36″ posters, and frame locally or buy frames online through Amazon. Then share your stories with me about the responses you receive!
Benefit from over 90 years of stock market history
Our tool’s heat map visualization helps investors and financial advisors direct focus away from over 4,500 return numbers (US indexes) to more powerful and relevant long-term trends.
Train your advisory team
Market history isn’t typically taught in Certified Financial Planner™ courses. Use our app to prep next-gen advisors for client interactions.
Mitigate clients’ market anxiety
It’s not enough to tell yourself or your clients “this has happened before.” With The Index Matrix app and printed images (posters and handouts), you can actually show them.